KEY POINTS
- Greatest short-coming for intermittent energy sources is that there is no cost-effective battery technology, meaning that for 60% of the time, off-shore wind turbine power generation is sub-optimal;
- Modern nuclear power plants can expect to have a realistic lifespan of 80 to 100 years – whereas an equivalent wind turbine project will have to be assembled/disassembled four to five times; and
- Using two comparable UK examples, it is evident that for roughly the same capex outlay, traditional nuclear power is likely to deliver almost double the power output than that of an equivalent off-shore wind turbine project[1].
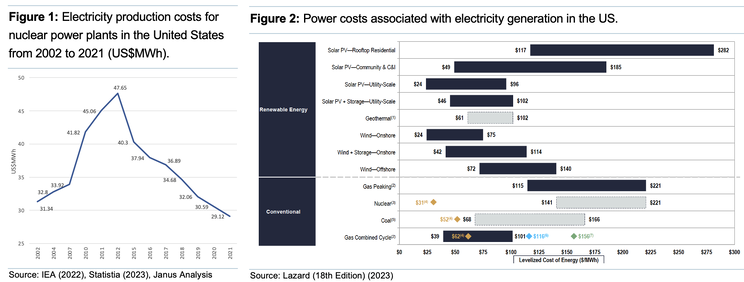
The nuclear power industry is increasingly up against a new generation of green and renewable technologies, particularly solar and wind, with a substantial body of cost analysis that renewables are considerably cheaper sources of power; best summarised by levelised power costs in Figure 2. In that diagram, we would draw attention to the nuclear quote (in gold) of $31MWh[2] for nuclear power, representing the marginal cost of operating US nuclear facilities (unsubsidised), inclusive of decommissioning costs. This estimate matches actual electricity production costs from nuclear power plants in the US from 2002 and 2021 (see Figure 1), a fraction of the estimation of unsubsidised prices of $141–$221/MWh for nuclear in Figure 2.

IEA estimate that the LCOE[3](i.e. the average net present cost of electricity generation for a single nuclear power plant over its lifetime) is around ~$60MWh; the cost discrepancy between the cost of nuclear power in the US and IEA estimates is, in part, because the US nuclear power plants were originally only designed to last 40-years. But at last count, 87 of the 92 commercially operating nuclear reactors have had their licenses officially extended to 60 years[4], and we see no real impediment on why they cannot be extended further.
With production now <$30MWh, and the potential to fall further, these costs represent nuclear power plants without any associated capex. If you want to compare that to wholesale power prices in Europe, which increased by more than 400% from an average of €35MWh (US$40MWh) in 2020 to almost €250MWh in December 2021 (even before the war in Ukraine), reaching a peak of >€500MWh in March 2022.
In the UK, Hinkley Point C has a Contract for Difference (CoD) price of £92.5MWh (~US$112MWh), because it is designed to operate a minimum of 60-years[5], but we contend, will most likely last ~100. Whilst nuclear power has significant upfront costs, there are several advantages, including a low level of greenhouse gas generation per unit of power generated, with a consistent and reliable source of baseload power. The key determinants influencing a comparative cost benefit analysis between various energy sources, in particular, nuclear power, hinge upon:
- High initial capital costs[6] associated with establishing safety systems, containment structures, requires substantial upfront investment. Although it has to be noted that fuel, operation and maintenance outlays are a relatively small components of the total cost;
- Long construction timelines, typically extend over a decade, often because safety and regulatory requirements inevitably lead to higher financing costs[7], delays, and cost overruns because of inflationary pressures; and
- Decommissioning at the end of a power plant’s life, including dismantling the facility, reprocessing, storage and management of radioactive waste.
Hinkley C Nuclear vs Dogger Bank Wind Turbine Capex Comparison
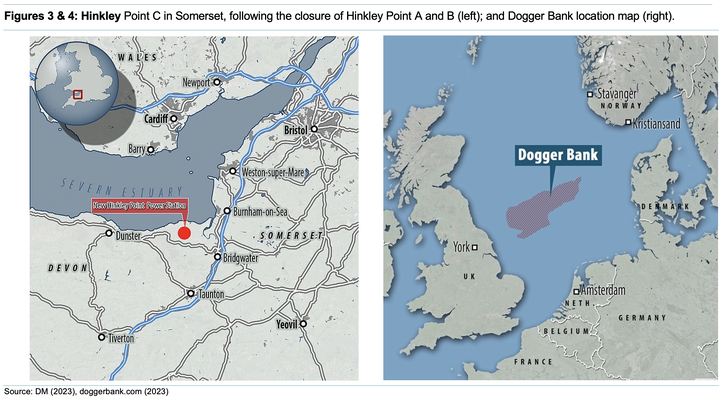
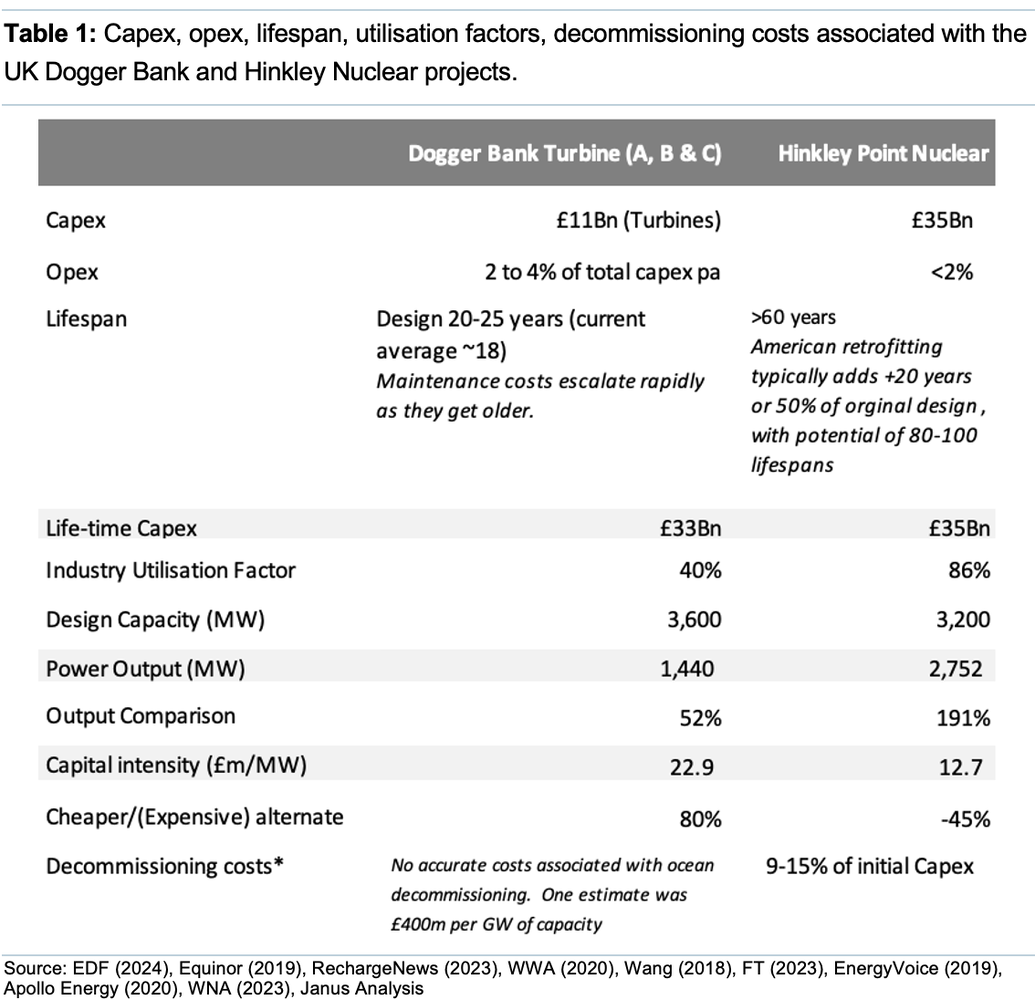
According to Figure 2, the cost of off-shore wind power is estimated to be 30-40% of that forecast for nuclear power. To verify this claim, we have compared Hinkley C with its latest updated cost profile; a nuclear programme that has run substantially over budget and time; against three highly publicised wind turbine projects collectively known as the Dogger Bank[8] programme. With a capacity of 3.6GW (e.g. equivalent of three mid-sized nuclear power plants), they commenced production late 2023 onwards[9]. The point about this comparison is that we can be reasonably confident on costs, since they are published actuals with overlapping construction periods, in the same geographical region, influenced by identical inflationary pressures.

The straight cost benefit assumptions are as follows:
- Hinkley C capex numbers[10] have just been updated to ~£35Bn, driven primarily by inflation; and is likely to increase again (marginally) before its completion in 2027;
- Latest capex update for Dogger Bank (February 2022) project estimate[11] ~£11Bn, >20% higher than the original, significantly below the prevailing capex inflation rate;
- A production period of 60 years, matching the initial design lifespan of Hinkley C. We have assumed a turbine life span of 22.5 years (despite the UK turbine average of ~18-years[12]);
- The introduction of permanent magnets eliminating wind-turbine gearboxes[13], making them substantially more reliable, lowering maintenance requirements, and extending their lifespans upwards of 25-years;
- Given the time period considered, we assume that the turbines will be de-and reassembled three times. We have used the current nominal capex amount (£33Bn) and have not attempted to adjust for future inflation;
- Have not included decommissioning costs, simply because no off-shore projects have yet been disassembled[14];
- Not adjusted wind turbine productive output lost for disassembly and reassembly, which we estimate, could take ~2-3 years in each instance; and
- Hinkley C is likely to have a productive lifespan of 80 to 100 years[15]. The shorter lifespan (60 years in this comparison) should benefit the wind turbines because of the large upfront capex costs associated with nuclear reactors, the financial impact of which, diminish significantly if amortised over a longer time-period;
Comparison Conclusions
- Despite Dogger Bank having a slightly (>12%) larger project design capacity, using an UK offshore average capacity factor (~40%)[16], it is likely it will only produce half of the power output (on an intermittent basis) expected from Hinkley C (see Table 1 – assuming a conservative 86% utilisation factor[17] for nuclear power); and
- The most outstanding aspect of this comparison is the fact that the capital intensity per MW generated for Hinkley C (£11.9m per MW) is approximately half that of Dogger Bank (£22.9m per MW).

Footnotes
[1] We have not attempted to model cashflows, we assume identical revenue per unit of output.
[2] Electricity production costs for nuclear power plants in the United States averaged US$29.12MWh in 2021. But those reactors were built decades earlier, capex costs have been depreciated down to zero, so are not really representative of a new build. The only way these projects can be directly compared, is to cost each project with roughly equivalent outputs, over an equal time frame.
[3] Levelised cost of electricity (LCOE) is the average cost of generating a unit of electricity taking into account costs incurred during construction, operation and maintenance. LCOE calculation, however, typically oversimplifies project parameters, including operational risks, maintenance, interest rates, capex, etc., and importantly, non-comparable jurisdictions and timelines. For example, nuclear has higher capital costs, but lower operating costs than coal or natural gas. Setting a higher interest rate for the LCOE calculation will favour low capex projects.
[4] As of April 2020, 20 reactors, are planning or intending to operate for up to 80 years; the vast majority remaining are expected to renew as they approach the end of their current operating licenses – https://www.energy.gov/ne/articles/whats-lifespan-nuclear-reactor-much-longer-you-might-think#
[5] Important when comparing energy costs for projects with different timelines, to consider the time value of money and the impact of inflation, any accurate analysis will have to take into account the full lifecycle costs of the projects.
[6] Nuclear power plants have long operational lifetimes, new models typically exceeding 60 years operationally, with extensional programmes, that can reach 80 to 100 years, meaning these upfront costs are increasingly amortised over an extended period. Although outside the direct remit of this note, overall costs vary significantly depending upon location, regulatory environment, but we argue that nuclear power over the long-term is extremely cost efficient on a like-for-like basis (i.e. we model using 60-year life span).
[7] Financing costs over long construction periods, include interest payments on loans, compounding interest (i.e. P*(1+i)^n) – P) , the longer the time period the more significant the impact. For example, an upfront loan at 10% pa over a decade, will increase costs ~130% in nominal terms. Because of the regulatory hurdles in the West, it is not uncommon for a project to take 10-15 years.
[8] Dogger Bank is a large sandbank in a shallow area of the North Sea, located ~100km off the east coast of England. The off-shore wind programme is a JV between SSE Renewables (40%), Equinor (40%) and Vårgrønn (20%) consisting of three stages: A (95 turbines), B (95 turbines) and C (87 turbines). First power for Project A was October 2023, whilst Project B is scheduled for Q324. Project C will utilise GE Haliade 14MW turbines, with installation to commence in 2025, with completion in 2026.
[9] Electricity turbine tariffs were settled in November 2020 at auction with a strike price ~ £41.61MWh (adjusted annually for inflation) for 15 years which then reverts to the prevailing market price. To put that in perspective, current UK energy wholesale weekly spot prices (ofgem.gov.uk) are £69MWh, after peaking at £511.2MWh August 2022.
[10] https://www.telegraph.co.uk/business/2024/01/23/hinkley-point-c-nuclear-delay-again-costs-jump-35bn/ A significant portion of the capex increases can be explained by inflationary pressures since EDF first started promoting this project in 2008 and when it began construction in 2016. At that point in time, it was estimated to cost ~£18bn to build, although some of the additional cost increases were due to unforeseeable ground conditions.
[12] According to TWI (https://www.twi-global.com/technical-knowledge/faqs/how-long-do-wind-turbines-last), O&M costs vary depending upon the age of the asset. For a new turbine, these costs may be only 10-15%, but increase to 20-35% towards the end of the lifecycle. Primary factors are typically site specific, but include average wind speeds, turbulence intensities and, for offshore wind farm operators, cyclic loading of foundations, jacket structures and monopiles caused by waves. There are also considerations associated with fatigue failure from wind turbine blades, wiring and hydraulic systems.
[13] https://www.engineering.com/story/the-future-of-wind-turbines-comparing-direct-drive-and-gearbox
[14] According to Breman (2020), the cost of decommissioning a wind turbine is between 2 and 10% of the initial investment, depending on the type of turbine and where it is installed. Spyroudi (2021) estimates that ~600 offshore wind turbines need to be decommissioned by 2030. Interestingly, the O&G sector is facing higher than expected cost crisis for its platform decommissioning, due to initial under-estimates, and lack of early planning. Although, in many cases, wind farm owners agree a decommissioning bond as part of their initial leasing agreement, the nominal cost can become unrealistic after 25 years. https://ore.catapult.org.uk/wp-content/uploads/2021/04/End-of-Life-decision-planning-in-offshore-wind_FINAL_AS-1.pdf By contrast, the decommissioning costs for nuclear power plants is well understood.
[15] New nuclear designs allow lifespans of 60 to 80 years, and one would reasonably assume that future plant refurbishments would extend this life span even further.
[16] Calculated for each UK offshore wind farm, the number of hours since it was commissioned, multiplied by its capacity, to give the number of peak MWh. This is then divided into the total energy generated by that particular wind farm, to derive its capacity factor. https://energynumbers.info/uk-offshore-wind-capacity-factors.
[17] In 2021, the global average capacity factor was 82.4% and reactors of all ages, not just new reactors of more advanced designs, including those that are in the process of closing down. North America averaged ~90%, which is the recommended utilisation factor by WNA for new builds. To be conservative, we used an average between the two (i.e. 86%). https://www.world-nuclear.org/getmedia/9dafaf70-20c2-4c3f-ab80-f5024883d9da/World-Nuclear-Performance-Report-2022.pdf.aspx
Disclosures
This document is provided for information purposes only and should not be regarded as an offer, solicitation, invitation, inducement or recommendation relating to the subscription, purchase or sale of any security or other financial instrument. This document does not constitute, and should not be interpreted as, investment advice. It is accordingly recommended that you should seek independent advice from a suitably qualified professional advisor before taking any decisions in relation to the investments detailed herein. All expressions of opinions and estimates constitute a judgement and, unless otherwise stated, are those of the author and the research department of Janus Analysis only, and are subject to change without notice. Janus Analysis is under no obligation to update the information contained herein. Whilst Janus Analysis has taken all reasonable care to ensure that the information contained in this document is not untrue or misleading at the time of publication, Janus Analysis cannot guarantee its accuracy or completeness, and you should not act on it without first independently verifying its contents. This document is not guaranteed to be a complete statement or summary of any securities, markets, reports or developments referred to herein. No representation or warranty either expressed or implied is made, nor responsibility of any kind is accepted, by Janus Analysis or any of its respective directors, officers, employees or analysts either as to the accuracy or completeness of any information contained in this document nor should it be relied on as such. No liability whatsoever is accepted by Janus Analysis or any of its respective directors, officers, employees or analysts for any loss, whether direct or consequential, arising whether directly or indirectly as a result of the recipient acting on the content of this document, including, without limitation, lost profits arising from the use of this document or any of its contents.
This document is provided with the understanding that Janus Analysis is not acting in a fiduciary capacity and it is not a personal recommendation to you. Investing in securities entails risks. Past performance is not necessarily a guide to future performance. The value of and the income produced by products may fluctuate, so that an investor may get back less than he invested. Investments in the entities and/or the securities or other financial instruments referred to are not suitable for all investors and this document should not be relied upon in substitution for the exercise of independent judgment in relation to any such investment.
Janus Analysis may have issued other documents that are inconsistent with and reach different conclusions from, the information contained in this document. Those documents reflect the different assumptions, views and analytical methods of their authors. No director, officer or employee of Janus Analysis is on the board of directors of any company referenced herein and no one at any such referenced company is on the board of directors of Janus Analysis.
Analysts’ Certification
The analysts involved in the production of this document hereby certify that the views expressed in this document accurately reflect their personal views about the securities mentioned herein. The analysts point out that they may buy, sell or already have taken positions in the securities, and related financial instruments, mentioned in this document.
