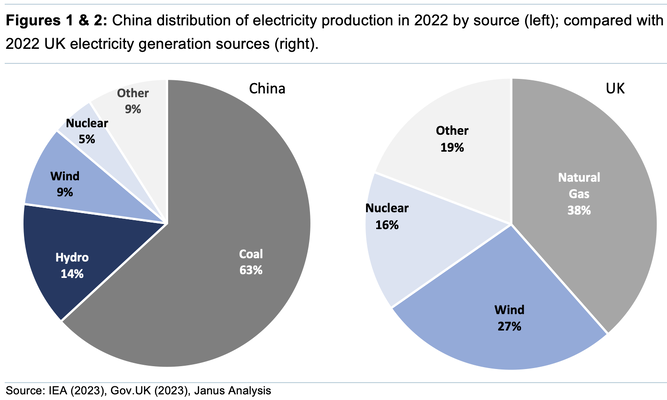
We have always maintained that the use of the term “EV” is a misnomer, because it doesn’t in any way reflect the energy source. It is probably more accurate to refer to these vehicles as solar, wind, nuclear or even gas-powered, thereby reflecting the origin of the fuel resource. The inherent strength of EVs is that they are capable of producing virtually zero CO2. The caveat to that statement, however, is that they are highly dependent on the source of the stored energy. Battery electric vehicles (BEVs) and plug-in hybrid electric vehicles (PHEVs) make up ~80% of new car purchases in Norway, which sources ~98% of its domestic electricity from hydro. By contrast, ~63% of China’s electricity generation is from coal-fired power generation.
China EV vs UK Vehicle CO2 Comparison
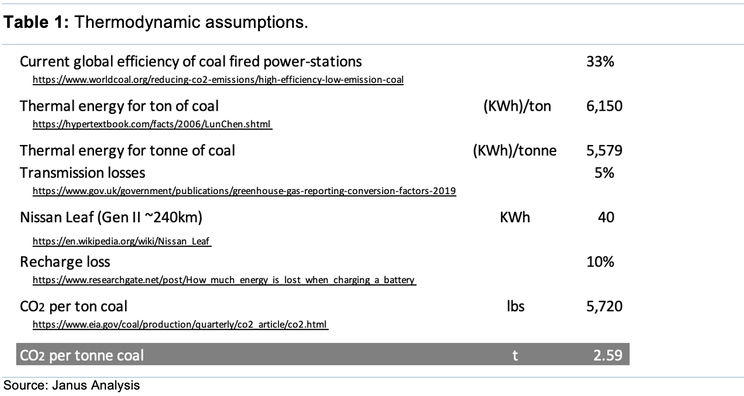
This is an updated summary we have completed several times previously, reflecting the changing energy abundances from within China and the UK. Like other comparisons in this note, the bias is strongly skewed toward EVs so that a degree of impartiality can be maintained. To make the point of how important the fuel source is for the electricity generated and to quantify the CO2 emissions generated by an atypical Chinese EV[1], we have conducted our own analysis from first principles. We have enclosed the equivalent UK power mix from 2022 as a direct comparison (see Figures 1 & 2), the key difference being the preponderance of wind generation and gas[2] in the UK, versus coal fired generation in China.
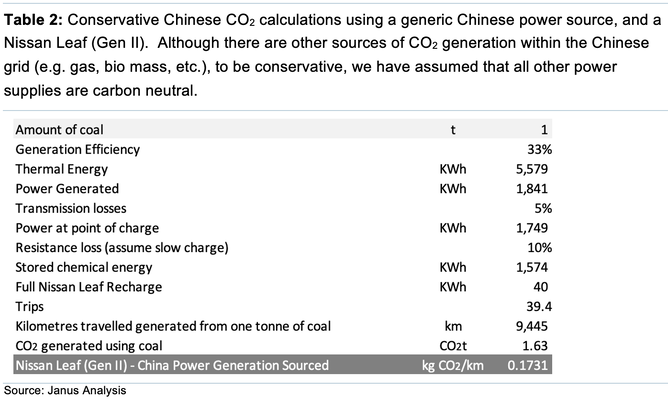
We selected the efficient Nissan Leaf (Gen II) as a basis for an EV operating in China using a generic power mix as seen Figure 2. This is a conservative option given the disparate breadth of the Chinese EV market, we believe the Leaf is actually more efficient than the Chinese collective.
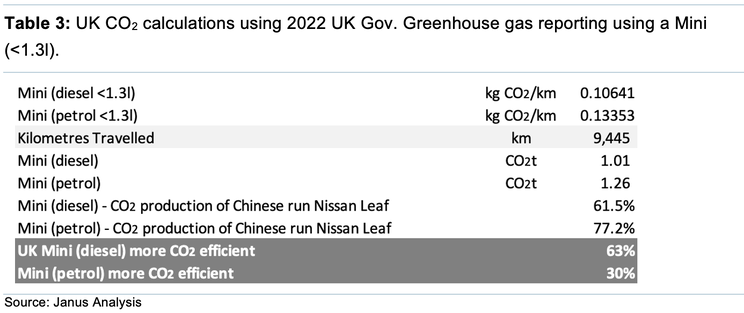
In Table 3, we compare our calculated Chinese EV vehicle with a Mini (<1.5l), using UK CO2 calculations from the 2022 UK Gov Greenhouse gas calculation[3]. This indicates that the average Chinese EV (operationally) produces substantially more CO2/km than its UK petrol (~30%) or diesel (~63%) equivalent. Importantly, these UK government CO2/km figures do not reflect theoretical outputs from the latest models on for sale, rather, actuals, as measured by the Department of Transport, DVLA, and ANPR; with factors updated annually to reflect spectrum changes in the different types of vehicles and age on UK roads.
Although the exact quantum is up for discussion, it is indisputable that EVs (in their current semblance) are not the environmental panacea that many vested interests claim.
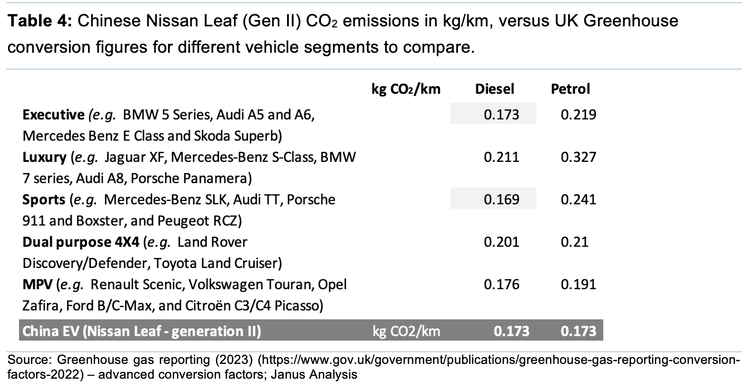
Remarkably, several UK classes of substantially larger and heavier vehicles (i.e. executive and sports diesels) produce less atmospheric carbon than the average Chinese EV; and in most instances, the resultant emissions are not significantly different.
That conclusion, however, should not be taken at face value. Firstly, even within the UK, the general populace does not drive around in Minis with capacities <1.3 litres. Moreover, countries such as the US, Canada and Australia require larger capacity vehicles able to travel greater distances, producing correspondingly higher carbon emissions. Moreover, this comparison merely represents a single point in time, and doesn’t reflect the fact that a country’s sources of energy change over time. We have been monitoring the Chinese energy mix for several years now, and if we compare 2022’s energy mix with that from 2020, we note that current CO2 generation (per unit of energy) has fallen around seven percent, primarily due to a five percent drop in coal consumption[4], four percent drop in hydro power (due to drought), offset by a three percent rise in wind turbine power.
The lacklustre ability of EVs to mitigate CO2 emissions has long been well known, but not widely publicised. Older studies[5] by EEA with the current “EU energy mix” suggest that over the entire vehicle life cycle, EVs have ~17-30% lower emissions than petrol and diesel cars, respectively. These savings can be considered modest (at best), because it only considers operational emissions, not assembly; where the manufacture of an EV is far more CO2 intensive than that of an internal combustion engine (ICE). More recent studies[6] suggest that the average new-car emissions are higher than they were a decade ago, despite the uptake of EVs and hybrids, primarily due to the dramatic increase in popularity of SUVs; with on average, seven-year-old petrol and diesel cars having the lowest CO2 output per kilometre of all the cars in the UK (excluding EVs).
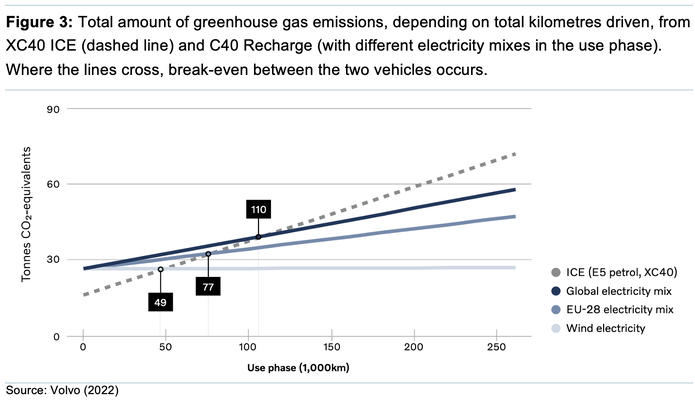
Volvo[7] is the first OEM to thoroughly look at emissions associated with the complete process, from assembly to lifetime CO2 emissions, using the ICE and EV versions of the same model[8]. Incorporating emanations/by-products from resource extraction to disposal, then performing a like-for-like comparison, it found that the breakeven points for CO2 parity between an ICE and a BEV were quite significant; that it would take a typical BEV driver 110,000km to reach CO2 emission equality (see Figure 3). Using an EU generation mix (greater quantum of renewables and nuclear power) a BEV driver would only need to drive 77,000km to reach CO2 parity with an internal combustion engine (ICE). Remarkably, using just wind power as its primary power source, it would still take 49,000km for a BEV to break-even in greenhouse gas emissions with an ICE.
KEY POINTS
- There are a lack of economic energy storage technologies to realistically service intermittent power sources. The current thesis calls for the exponential growth in the renewables sector; with either lithium batteries or hydrogen[9], providing storage for intermittent renewables-based systems; such as solar and wind. At peak outputs, surplus energy (in addition to that being consumed by the grid) would be converted back to electricity; potentially either in stationary or mobile applications;
- Significant difference in capex plant required and the combination of metals to construct an EV over an ICE, due to its structural complexity; we don’t expect that disparity to decline into the future;
- Assuming ceteris paribus, unless many nations embrace nuclear power, it is entirely possible that widespread adoption of EVs could, in many cases, increase automotive CO2 emissions[10];
- The reliance on China (and increasingly India), and their use of cheap authigenic carbon-based energies give them the economic advantage over their Western counterparts. In addition, China has secured a number of critical commodity supplies globally, including processing and refining, which underlies the basis of our belief that we are transitioning towards a more mercantilist future. Cheap and plentiful baseload energy via widespread nuclear power, could reverse this trend, and result in a more sustainable bi-polar Western/BRIC world; and
- Transitioning to a carbon-light economy will dramatically increase most Western nations’ requirements for commodities at a time when they have eschewed mineral investment; and are, therefore, becoming increasingly reliant on those that do supply them.
Footnotes
[1] We would firstly admit there is no typical Chinese EV, moreover, and as far as we are aware, no one seems to have an accurate breakdown as to the size, power outputs or cost distribution of EVs sold within the Middle Kingdom. We merely make the point that there are > 450 registered EV firms in China, most of whom specialise in producing small EVs. Much like the Kei car category in Japan, Chinese EVs differ significantly in size, range, features and structural integrity, and are unlikely to be appealing or meet Western safety standards, and for the purpose of commodity forecasting, unlikely to be sold in any significant numbers outside its domestic market. The Hongguang Mini has been the best-selling EV in China for several years, and has an official range of 120km (~75-80km real world), weighing 665kg, its electric motor providing 15kW and 85nm of torque powering the rear wheels; powered by a 9.2kWh battery, prices start at US$4,300 or £3,600 per unit. By comparison, the cheapest EV sold in the UK is the MG4 (Chinese owned), starting at £26,650 per unit, weighing 1,660kg, powered by a 50kWh battery, and has an official range of 350km.
[2] Natural gas mainly consists of methane (CH4), containing a higher proportion of hydrogen compared with that of coal, meaning it will produce fewer CO2 emissions compared to coal for the same amount of energy generated; and is why it is considered the cleaner fossil fuel (in terms of greenhouse gas emissions). Although, it has to be noted that methane’s global warming potential is estimated to be around 25 to 30x that of CO2 over a 20-year period.
[3] Not included are CH4 or N2O in calculations to estimate a CO2 equivalent, because, although these numbers are supplied by the UK Government, we could not accurately quantify Chinese outputs. In any case, they make a marginal difference only.
[4] It is generally accepted that China consumed ~4.3-4.4Bnt in 2022, although it is difficult to quantify; officially, coal-fired power generation grew slightly (~1.4%) despite the fact that major coal-using sectors, including steel and cement, contracted. In calculating coal CO2 generation, it is just as important to quantify the energy content of the coal used, as it varies widely, with the most energy-dense export categories containing up to double the energy per tonne, as the lowest-quality commercially used varieties (e.g. Hard coking coal vs Newcastle spec vs Indonesian imports vs domestic sources from Inner Mongolia). The point being, the thermal energy estimate we used in Table 1 is purposely on the high side (it could be potentially lower by 25%); hence, the amount of CO2 produced, is likely to be materially higher.
[6] P. 12 Figure 1: https://docs.google.com/document/d/1b5h3g02oED9E_-W6yOZTqDxSyEVCvBG-oL3TiLqECcA/edit
[7] https://www.volvocars.com/images/v/-/media/market-assets/intl/applications/dotcom/pdf/c40/volvo-c40-recharge-lca- report.pdf
[8] XC40 ICE and C40 Recharge models.
[9] From a cost-benefit point of view, the question has to be asked – Why do we need hydrogen as a green transport source when electric cars already exist? Reliable, relatively cheap opex, recharge via a socket using existing grid infrastructure.
[10] The only other realistic alternative is unconventional-geothermal, which could be decades away from commercialisation. We think the most advanced geothermal play is Quaise (https://www.quaise.energy), an unlisted energy company spinout from MIT attempting to unlock cheap drilling technique to depth employing millimetre wave drilling technology using a gyrotron.
Disclosures
This document is provided for information purposes only and should not be regarded as an offer, solicitation, invitation, inducement or recommendation relating to the subscription, purchase or sale of any security or other financial instrument. This document does not constitute, and should not be interpreted as, investment advice. It is accordingly recommended that you should seek independent advice from a suitably qualified professional advisor before taking any decisions in relation to the investments detailed herein. All expressions of opinions and estimates constitute a judgement and, unless otherwise stated, are those of the author and the research department of Janus Analysis only, and are subject to change without notice. Janus Analysis is under no obligation to update the information contained herein. Whilst Janus Analysis has taken all reasonable care to ensure that the information contained in this document is not untrue or misleading at the time of publication, Janus Analysis cannot guarantee its accuracy or completeness, and you should not act on it without first independently verifying its contents. This document is not guaranteed to be a complete statement or summary of any securities, markets, reports or developments referred to herein. No representation or warranty either expressed or implied is made, nor responsibility of any kind is accepted, by Janus Analysis or any of its respective directors, officers, employees or analysts either as to the accuracy or completeness of any information contained in this document nor should it be relied on as such. No liability whatsoever is accepted by Janus Analysis or any of its respective directors, officers, employees or analysts for any loss, whether direct or consequential, arising whether directly or indirectly as a result of the recipient acting on the content of this document, including, without limitation, lost profits arising from the use of this document or any of its contents.
This document is provided with the understanding that Janus Analysis is not acting in a fiduciary capacity and it is not a personal recommendation to you. Investing in securities entails risks. Past performance is not necessarily a guide to future performance. The value of and the income produced by products may fluctuate, so that an investor may get back less than he invested. Investments in the entities and/or the securities or other financial instruments referred to are not suitable for all investors and this document should not be relied upon in substitution for the exercise of independent judgment in relation to any such investment.
Janus Analysis may have issued other documents that are inconsistent with and reach different conclusions from, the information contained in this document. Those documents reflect the different assumptions, views and analytical methods of their authors. No director, officer or employee of Janus Analysis is on the board of directors of any company referenced herein and no one at any such referenced company is on the board of directors of Janus Analysis.
Analysts’ Certification
The analysts involved in the production of this document hereby certify that the views expressed in this document accurately reflect their personal views about the securities mentioned herein. The analysts point out that they may buy, sell or already have taken positions in the securities, and related financial instruments, mentioned in this document.
