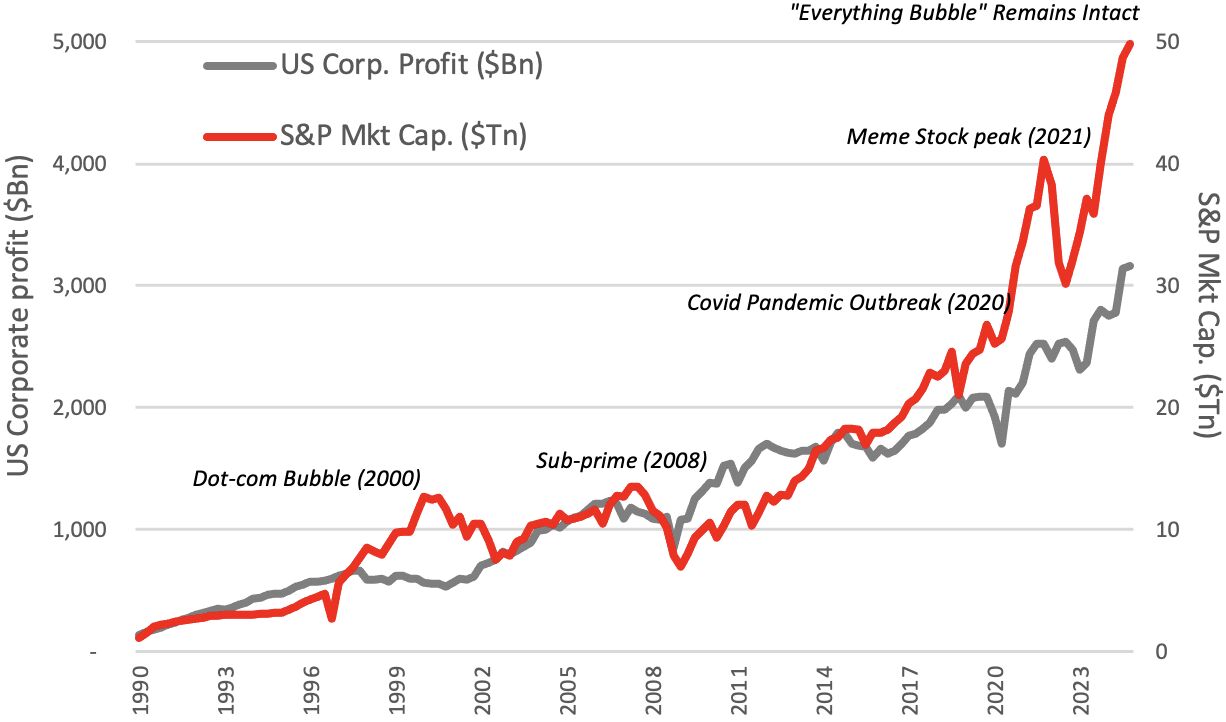
In a recent missive, we noted that although US profits are growing, they are highly skewed. Outside the top 20 stocks on the S&P 500, EPS has largely been flat, with the bottom 50% strongly negative YTD. Despite that, total market capitalisation has jumped >38% in under a year (red).
Company profitability is the closest thing we have to gravity in the financial markets, and in this instance, has been seriously lagging behind the growth in market capitalisations. Fundamentally, a share price is the sum of discounted cashflows, therefore, in the long-term, one would expect a significant correlation between market capitalisation and company profitability (up or down) until some sort of equilibrium is established. This relationship has clearly broken down, particularly from Q220 onwards; with overall valuations now considered extreme.
Although market bubbles may take many years to reach fruition (the current one commenced in 2013), the final explosive thrust to the top rarely lasts more than 18 months. Looking at historical analogues, ~70% of the total returns appear to occur in the last 12% of the total timeframe (as measured from start to finish). Meaning, hopping out of a bubble early, just because valuations are ridiculously high, could be financially disastrous.
An area of concern is that aggregate household asset allocation into equities has just reached ~48%, a level last seen in 2000 (during the Dotcom bubble); with some reports suggesting that Boomers (born between 1946 and 1964) average between 60-70% exposure. We remind that post a “mean reversion” event, markets have a tendency to travel sideways for a decade or more. Meaning any resultant crash will hit those most heavily invested (i.e. Boomers), ironically, at a stage of life that they can least afford.
The preservation of capital is critical for the investor – and is the reason why the continual readjustment of trailing stops is so critical.

