Key Points
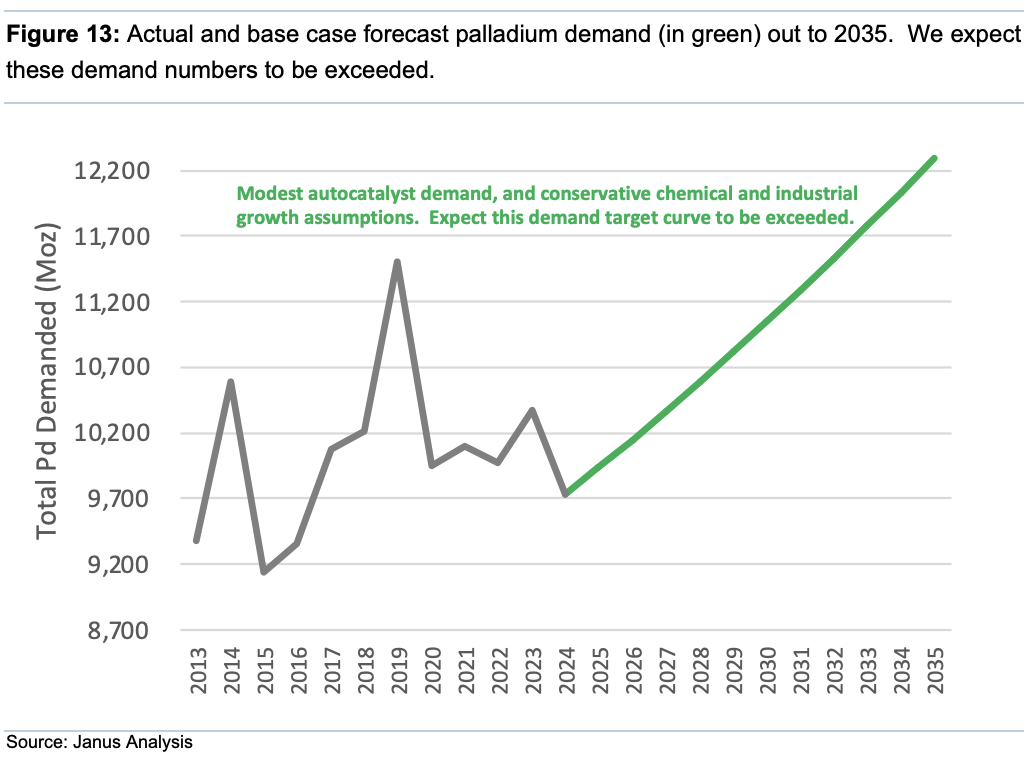
- Palladium (Pd) demand to grow 26% over the next decade
- Production dominated by Russia and South Africa
- Russian production sustainability under question
- Virtually all global Pd production is via by-product
- Significant price rises required to incentivise additional supply
We have been questioned about our EV commodity chain analysis that underlies our financial models. Originally, it was developed as a predictive transition model, using a sigmoidal adoption curve, which mimics the lifecycle of a product, service or technology. It summarises the dynamics of change, with a possible growth trajectory, from the point where a nascent population becomes established, the initial growth profile, to the point where numbers increase rapidly, until they reach some sort of equilibrium. We have found that the longer you progress along the adoption curve, the more accurate the numeric output becomes.
We initially applied this methodology to derive future demand profile for REEs and lithium. In hindsight, it has been remarkably accurate, for example, we forecast that lithium demand was to double inside of a decade, whereas every other major IB and commodity provider we saw had predictions 200-300% higher again; which, even at the time, had all the hallmarks of a self-reinforcing echo chamber. This methodology allowed us to Short EV makers four years ago.
Following a request, we wondered if our EV model could be applied to PGMs?
Supply – 15 Years in Structural Deficit
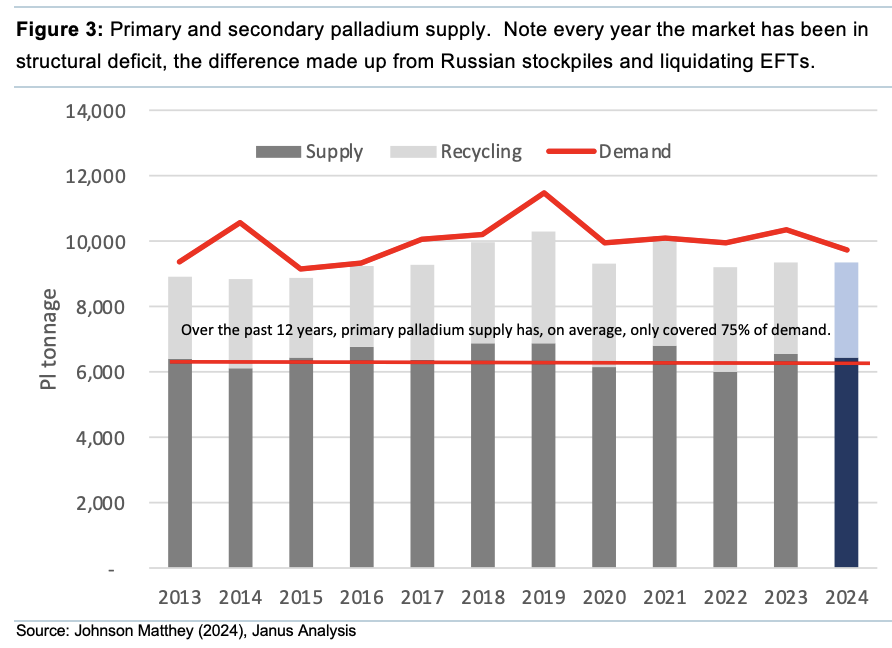
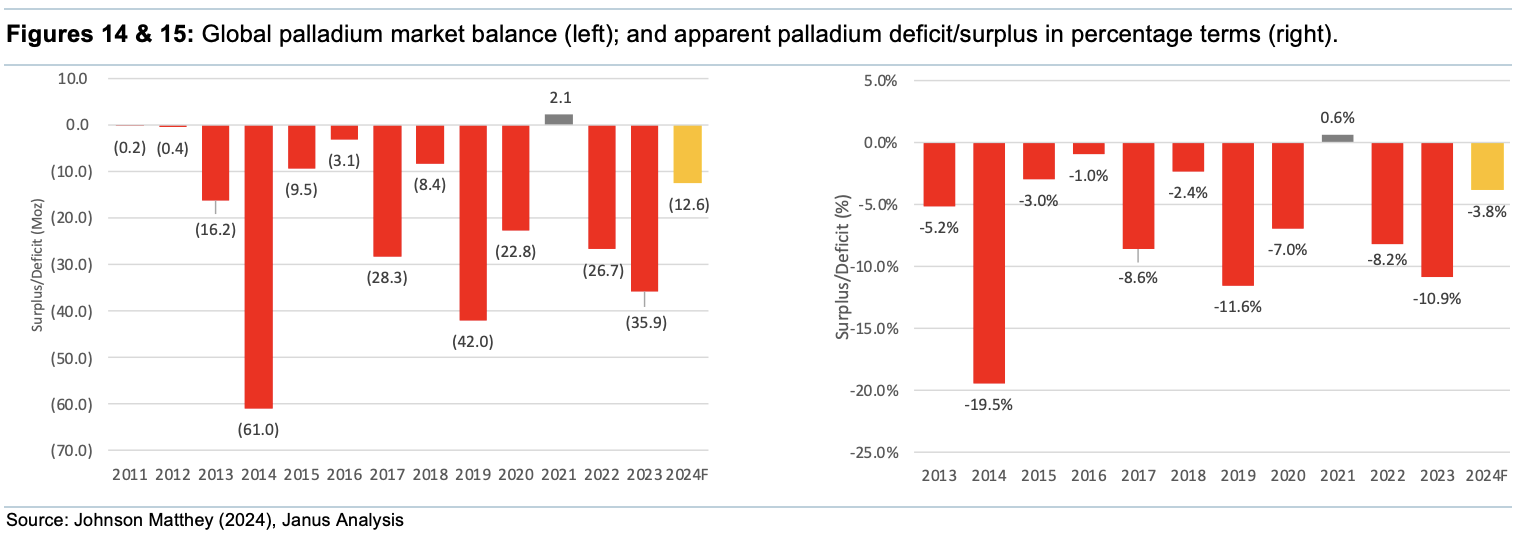
Over the past 12 years, primary Pd supply has, on average, covered 75% of demand (see Figure 3). Though primary PGE (platinum group elements) supply is dominated by South African producers (>80%), Russia is the world’s largest supplier of Pd. For the 15th consecutive year, the palladium market has been in a structural deficit (taking into account Russian restocking during the height of the covid pandemic). To date, this shortfall has been met by Russian supplies and liquidation of EFTs (exchange traded funds).
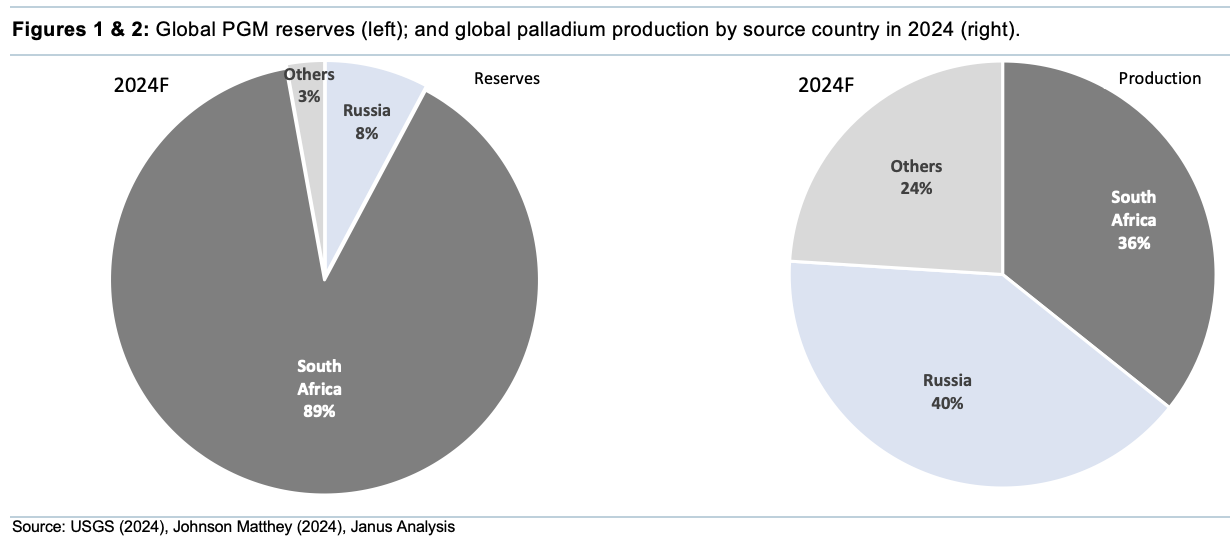
As previously mentioned, PGE production and resources are associated with three key geological occurrences: Bushveld Complex, in South Africa; the Great Dyke, in Zimbabwe; and the Norilsk region, Russia, where Pd is produced as a by-product from nickel mining. Russia produces about three times as much palladium as platinum, whilst South Africa supplies twice as much platinum as palladium.
Russian Pd Supplies Reliant on the Nickel Price
Mining first commenced within the Russian Norilsk region in the 1920’s, located in the centre of the 3msqkm Siberian continental flood basalt province, which formed from a superplume that ascended into the geometric centre of the Laurasian super continent (surrounded by subducting slabs of oceanic crust). The resultant Cu–Ni–PGE sulphide mineralisation occurs within olivine-bearing differentiated mafic intrusions, located stratigraphically beneath these flood basalts.
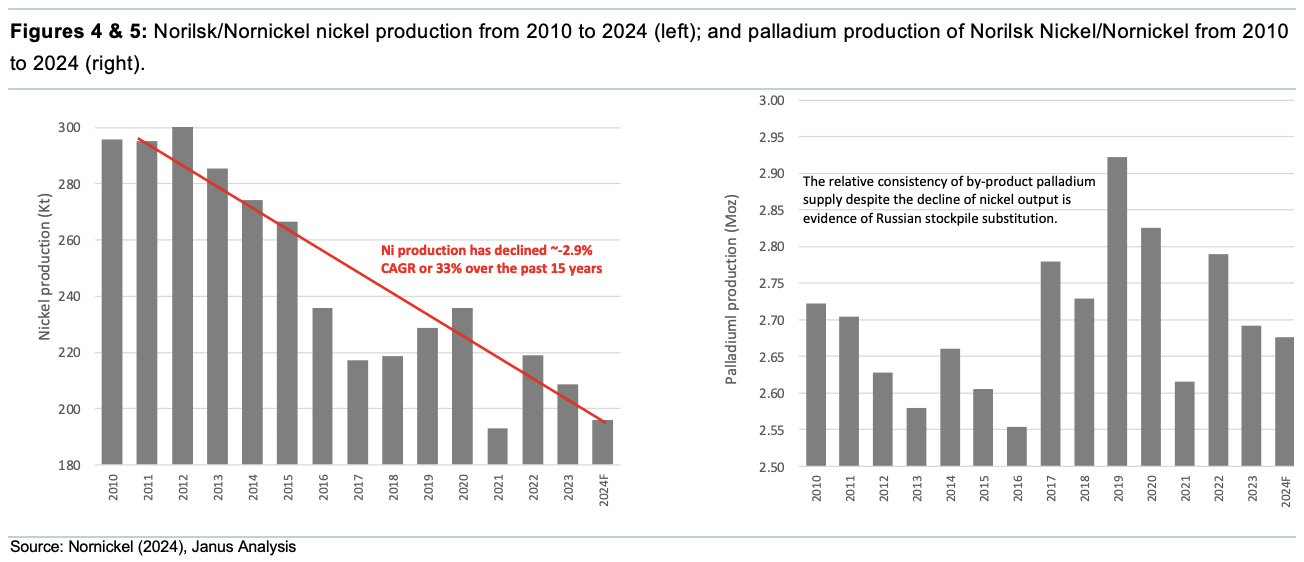
Given this nickel province has been mined continuously for over a century, “discovery depletion”,ceteris paribus, implies that the easier-to-find deposits are typically located first, with the more difficult deposits found later. These latter deposits, as a rule, are usually of a poorer quality economically than those found in the initial operating mines, in the sense that their production costs per unit of output are higher (e.g. mines become deeper – even if one accounts for the advancement of technology). Figures 4 & 5 illustrate that whilst nickel production has been continually declining over the past decade and a half at Norilsk, remarkably, Pd output remains stable. Assuming that deeper deposits are of similar resource grades, and recoveries haven’t materially changed, implies current Pd output is being substituted via historical stockpiles.
Nickel prices in recent times have been volatile, falling below US$16k/t in the H224, resulting from global Q324 demand falling 2.3% y-o-y, driven by a decrease in Chinese nickel consumption and the rapid rise in Indonesian production (accounting for >50% of the world’s supply). Collectively, Indonesia and China are forecast to account for ~75% of global refined nickel supply in 2026.
We are not implying that Russian PGE production is expensive, relatively, when compared with other operations, and that a drop in production is the result of cost pressures as active headings inevitably migrate deeper – they are and remain, the cheapest PGE producer globally (see Figure 6). Rather, their future production will be physically constrained by depth, and the fact that the country is fighting a major conflict in its Western region, which will limit capex, manpower, development metres and ultimately, Pd output. Even without sanctions (which are extremely unlikely given its strategic value), securing Russian Pd supplies by European/US manufacturers is difficult as the metal is transported via airfreight, with a number of Western countries having closed airspace to Russian planes.
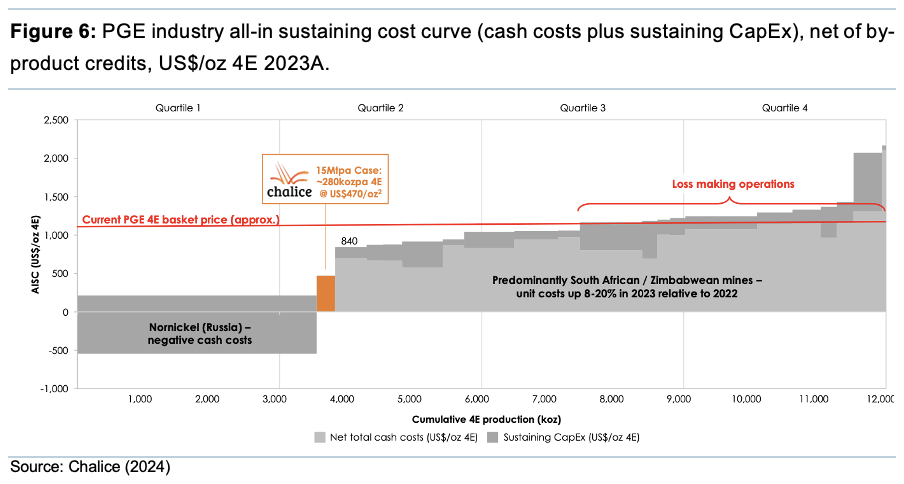
The only realistic source for material increases of Pd output are from existing South Africa operations, many of which are very old and have become run down. Anyone who has visited South African PGE operations underground would understand the infrastructure and power challenges, and this just to secure future production at current levels. Structural problems include – lack of capital, modest debt facilities, existing debt, high operating costs, aging infrastructure, labour difficulties, lack of modern equipment, politics, depth and intermittent power. To even contemplate increased production out of South Africa, would require substantially higher pricing than present (~US$900-1,000/oz Pd).
Hybrid Growth Underwriting Pd Demand
Palladium has a high melting point, is corrosion resistant, and is mostly utilised in automotive catalytic converters for petrol engines. In addition, it is a critical input for certain stages of semiconductor manufacturing, particularly in attaching chips to circuit boards and other metals. The concern in some quarters that Pd scrap supply may decline substantially in the longer term as the EV transition takes place, we believe, is misguided due to ongoing hybrid growth. Recycling of catalytic converters accounts for ~30% of palladium supplies globally in 2024F – with 80% sourced from autocatalysts (see Figure 8).
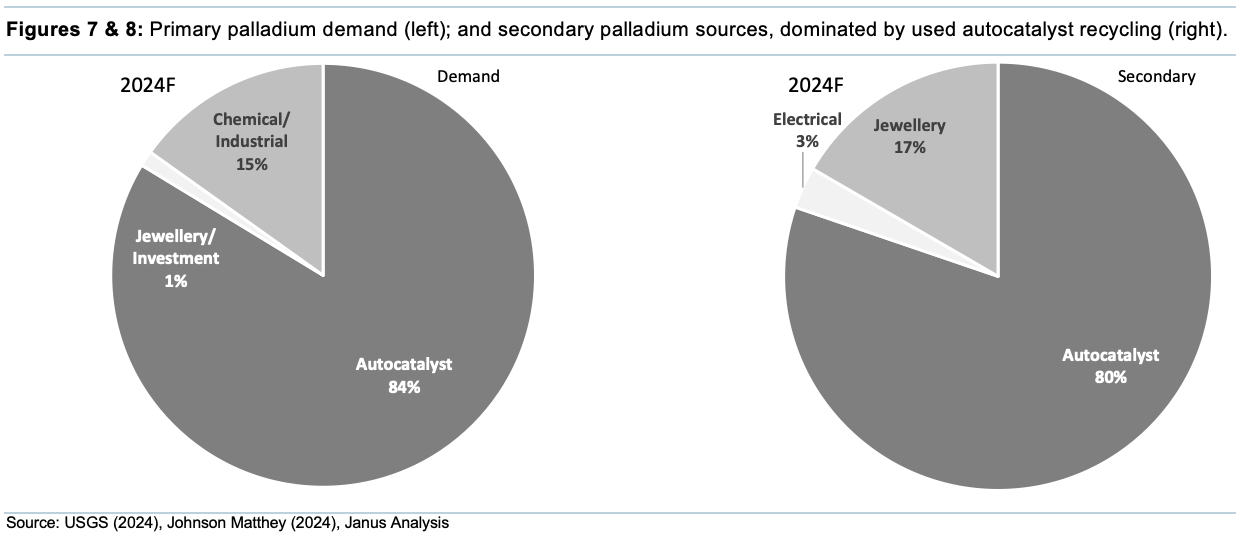
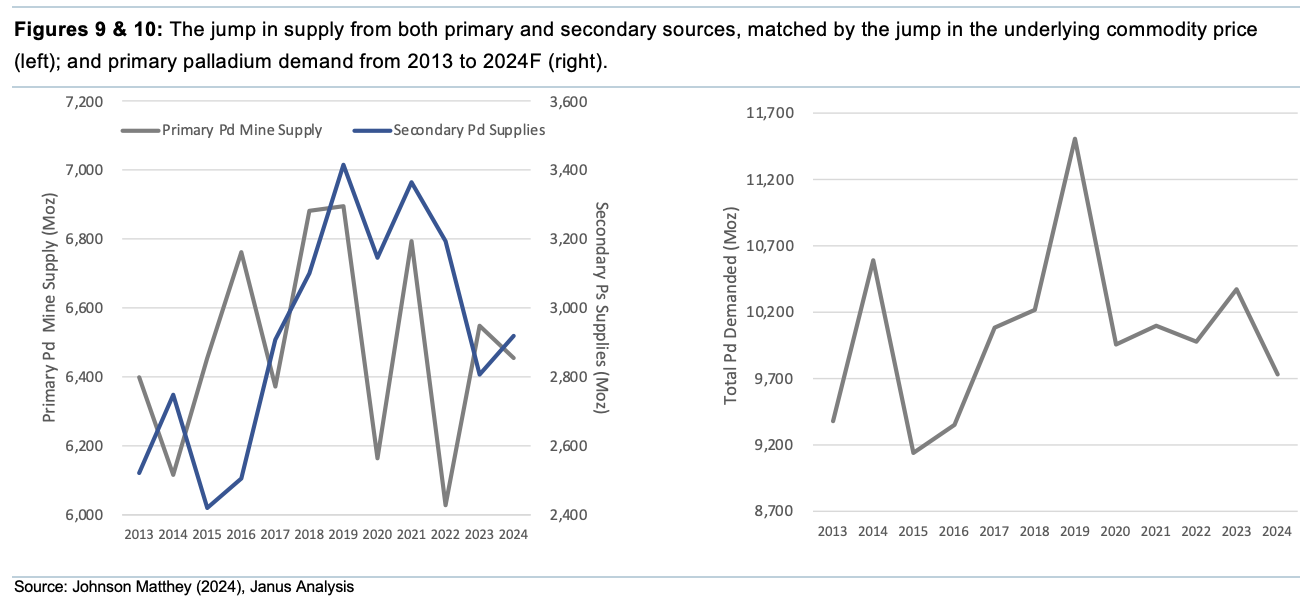
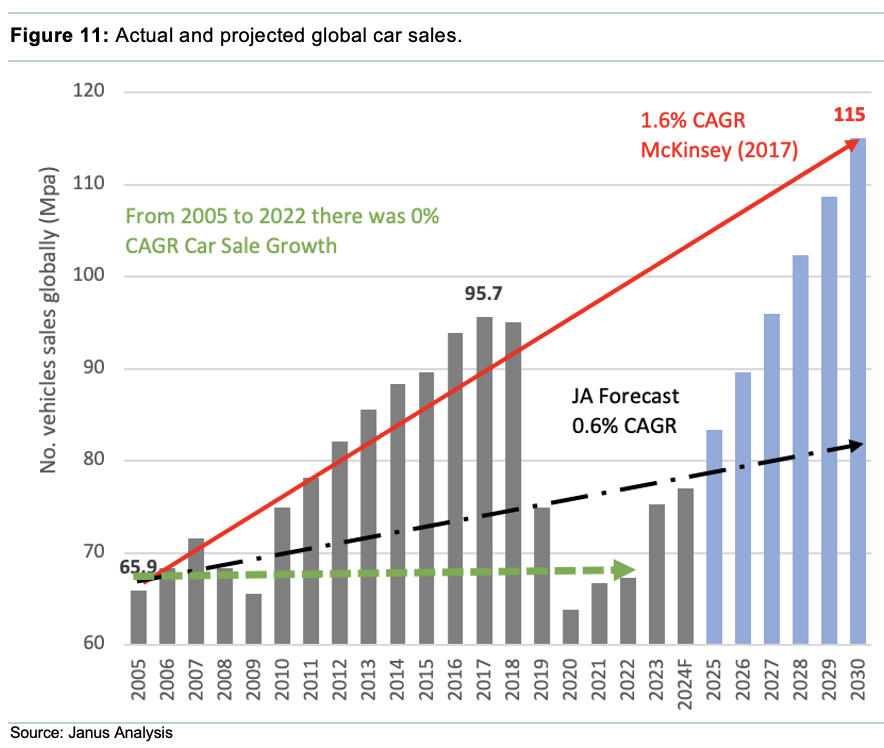
Global vehicle sales fell 33% from ~96m units in 2017, to its nadir of 64m units in 2019/20 (see Figure 11). Conversely, notional Pd demand over that period climbed >14% (compare with Figure 10). There is no ready explanation for this apparent incongruity; particularly when one considers that over that period Pd investment (including ETFs) was minus -620koz, and jewellery growth was a mere +131koz.
At the time, there was some commentary regarding imminent shortages emanating from Russian producers – a problem that never eventuated (see Figure 9). The only real credible explanation is that a number of industry end-users had, in anticipation of shortages, quietly procured substantial quantities of material as a form of insurance. Despite the purported shortages not eventuating at that time, we consider the narrative to be a valid long-term concern.
Although unquantifiable, financial innovation is an increasingly important player in commodity price determination. At present, there is a great deal of misplaced negativity surrounding Pd, that the petrol engine is facing extinction and is about to be replaced by the BEV (battery electric vehicle). Merely point out, that if resource supply shortages ensue in the coming years, ETF funds will receive positive inflows that will be allocated toward physical, which in turn will result in a self-fulfilling demand spike, exacerbating existing deficits.
Global Vehicle Sales
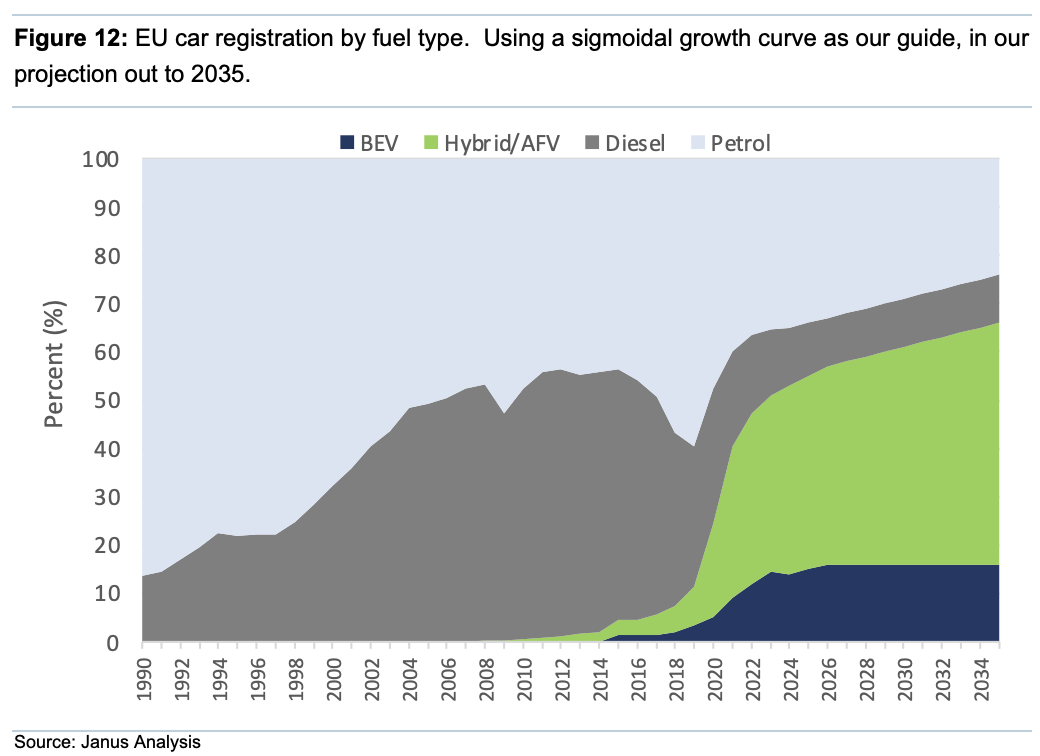
Our proprietary global vehicle sales model is used to constrain future Pd demand. Given our forecast is conservative, we believe it has to be considered a base-case scenario (unless we experience a GFC style recession). According to our analysis, BEV sales may have peaked (see Figure 12). Retain the view that hybrids will dominate the EV transition, which is a position we have maintained for the past five years.
Without a brand-new technological breakthrough, BEVs continue to have operational shortcomings (e.g. range, recharge rates, longevity) that are chemistry related, and are unlikely to be mitigated significantly by incremental technological improvements. In addition, BEVs are structurally more expensive to manufacture than ICEs, due to energy and associated materials requirements. Anecdotally, we are witnessing new adopters who bought Teslas a number of years ago and who are either transitioning to hybrids, or in many cases reverting back to ICE (internal combustion engines) vehicles (e.g. Porches). The new generation of BEV buyers appear to be targeting cheaper Chinese/Korean EVs, but many also retain an ICE/hybrid vehicle, for longer trips.
Rise of Hybrids
Sales data demonstrate that consumer preference toward hybrid/PHEV (plugin hybrid electric vehicles) vehicles is best suited for urban driving. Hybrids are at their most efficient when stopping and starting regularly, typically they increase fuel economy by >25% over their ICE comparables, with most newer models allowing a pure EV for short distances. Conversely, over open roads, their electrical systems add little to vehicle efficiency and actually penalise fuel consumption due to the additional weight of batteries and electrical motors.
Although the Toyota Pirus has been sold for more than two decades, it took quite a while for hybrids to be accepted. The rapid uptake since 2018 speaks to our investment narrative, that if a technology offers more efficient production of superior goods and/or services, then adoption is widespread (see Figure 12). Government subsidies, by contrast, distort consumer preferences and more often than not, the net economic benefit is far out-weighed by inefficient and wasteful allocation of resources.
Contrast the growth of EU BEV sales with that of hybrids (see below – navy blue vs green). That despite legislative penalties, subsidies and at various times, large incentives by Western governments to substitute ICE sales with EVs, they are simply not a viable option for many consumers. Forecast BEV sales to plateau from 2026 onwards; but equally, purchases could decline (in percentage terms) in favour of hybrids.
In 2025, we forecast 40% of all vehicles sold in the EU will be hybrids, rising to 50% by 2035. Hybrid cars cost, on average, ~+8% premium to the ICE equivalent (using Toyota models), with new models continually becoming more efficient over time. Hybrids still require substantial PGMs, in particular palladium, given the combustion engine is typically petrol powered, utilising between 2–6g Pd per unit (Nornickel, 2018), dependent on the model. Even if one takes into account technological advances, the proportion of PGMs required per vehicle into the future, will only decrease marginally.
Palladium Forecast – Price to Double in a Decade
Conclude that the investment community is too bearish on Pd, a strategic metal, it has strong growth dynamics looking forward. Critically, we believe that future supplies will be physically constrained, whether from Russia and/or South Africa.
KEY ASSUMPTIONS
- Global vehicular growth 0.6% CAGR;
- Hybrid growth 2.3% CAGR for the next decade;
- Petrol ICE sales to decline 29% over the next decade;
- Zero jewellery or investment ETF growth over the forecast period;
- Quantities of Pd used per catalyst remains stable; and
- Nornickel can maintain current Pd production levels for the next decade from existing stockpiles, irrespective of its nickel output.
CONCLUSIONS
- Envisage supply shortages over the coming decade even if production remains at current levels; and
- Serious questions regarding the sustainability of future Russian Pd output if nickel out continues to decline.
Uncertainties
- Virtually all global palladium production is a by-product, therefore, to alleviate any shortages, will require a significant above average Pd price increase to induce a market supply response, particularly from existing operations in South Africa;
- Despite the strategic importance of PGEs to large parts of the global economy, key producers are located within countries where geopolitical risk is a reality;
- Possibility of modest substitution of palladium with platinum in petrol-based vehicles, but we consider it non-material given superior thermal durability and NOx reduction properties; and
- When market participants start to anticipate future shortages, expect efforts to capture the arbitrage opportunity; the Pd price could appreciate dramatically (an unquantifiable event).
Disclosures
This document is provided for information purposes only and should not be regarded as an offer, solicitation, invitation, inducement or recommendation relating to the subscription, purchase or sale of any security or other financial instrument. This document does not constitute, and should not be interpreted as, investment advice. It is accordingly recommended that you should seek independent advice from a suitably qualified professional advisor before taking any decisions in relation to the investments detailed herein. All expressions of opinions and estimates constitute a judgement and, unless otherwise stated, are those of the author and the research department of Janus Analysis only, and are subject to change without notice. Janus Analysis is under no obligation to update the information contained herein. Whilst Janus Analysis has taken all reasonable care to ensure that the information contained in this document is not untrue or misleading at the time of publication, Janus Analysis cannot guarantee its accuracy or completeness, and you should not act on it without first independently verifying its contents. This document is not guaranteed to be a complete statement or summary of any securities, markets, reports or developments referred to herein. No representation or warranty either expressed or implied is made, nor responsibility of any kind is accepted, by Janus Analysis or any of its respective directors, officers, employees or analysts either as to the accuracy or completeness of any information contained in this document nor should it be relied on as such. No liability whatsoever is accepted by Janus Analysis or any of its respective directors, officers, employees or analysts for any loss, whether direct or consequential, arising whether directly or indirectly as a result of the recipient acting on the content of this document, including, without limitation, lost profits arising from the use of this document or any of its contents.
This document is provided with the understanding that Janus Analysis is not acting in a fiduciary capacity and it is not a personal recommendation to you. Investing in securities entails risks. Past performance is not necessarily a guide to future performance. The value of and the income produced by products may fluctuate, so that an investor may get back less than he invested. Investments in the entities and/or the securities or other financial instruments referred to are not suitable for all investors and this document should not be relied upon in substitution for the exercise of independent judgment in relation to any such investment.
Janus Analysis may have issued other documents that are inconsistent with and reach different conclusions from, the information contained in this document. Those documents reflect the different assumptions, views and analytical methods of their authors. No director, officer or employee of Janus Analysis is on the board of directors of any company referenced herein and no one at any such referenced company is on the board of directors of Janus Analysis.
Analysts’ Certification
The analysts involved in the production of this document hereby certify that the views expressed in this document accurately reflect their personal views about the securities mentioned herein. The analysts point out that they may buy, sell or already have taken positions in the securities, and related financial instruments, mentioned in this document.
